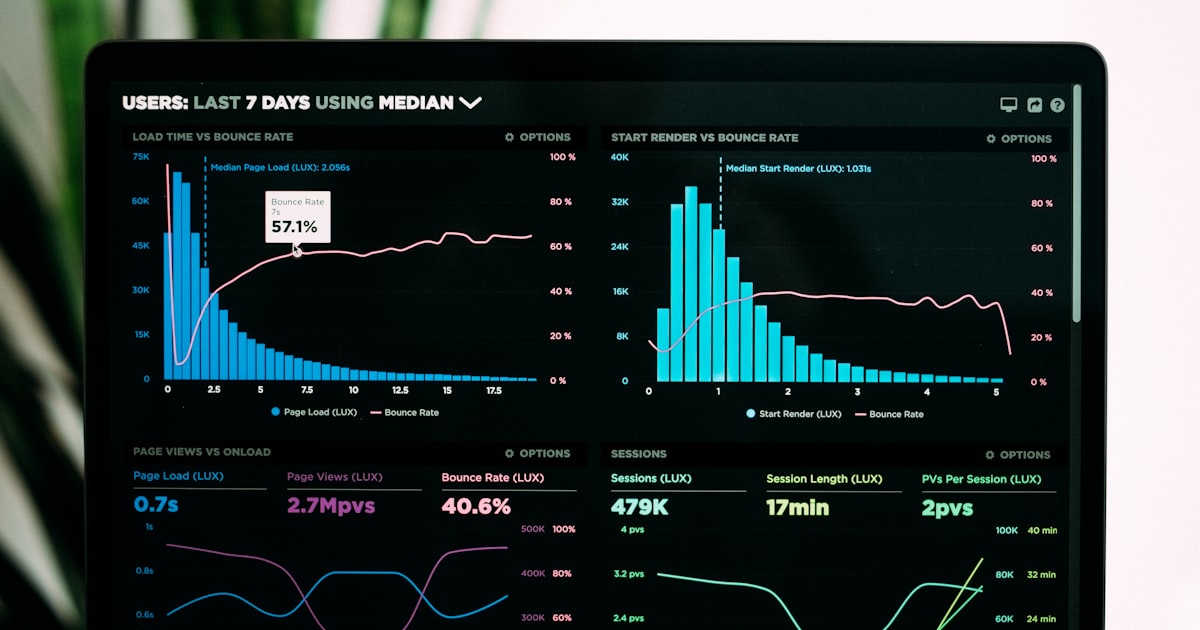
Custom Board: How to Build Your Own statpx Dashboard
Not every site owner cares about the same metrics. An e-commerce store wants pageview trends and top pages front and center; an agency managing content wants referrers and countries. statpx's Custom Board (custom_dashboard.php) lets you build a widget-based dashboard tailored to exactly what you check every day, instead of scrolling past sections you never use.
Opening the Custom Board
Open a site and click Custom Board in the sidebar. The first time you visit, statpx seeds a default layout for you — Pageviews, Unique Visitors, Sessions, Bounce Rate, and Avg. Duration as side-by-side KPI cards — so the page is never empty. From there, everything is yours to rearrange.
Adding, Removing, and Resizing Widgets
Click Add Widget to open the widget catalog. Available widgets include:
- KPI cards — Pageviews, Unique Visitors, Sessions, Bounce Rate, Avg. Duration.
- Top Pages — a ranked list of your most-viewed URLs.
- Referrers — where your traffic comes from.
- Countries — geographic breakdown of visitors.
- Devices and Browsers — technology breakdown.
- Pageview Trend Chart — a line chart of pageviews over time, useful as an anchor widget at the top of the board.
Each widget can be set to half width (two per row, good for KPI cards) or full width (better for tables and the trend chart). Use the widget's controls to drag it into a new position — the board remembers the order and width per user, per site, so your teammates can build a completely different layout on the same site without affecting yours.
Reordering and Removing Widgets
To reorder, drag a widget by its header to a new spot in the grid; the layout saves automatically. To remove a widget you no longer need, use its remove control — this only deletes it from your board, it doesn't affect the underlying data or anyone else's board. If you want to start over, a reset option restores the default five-KPI layout.
Common Mistakes to Avoid
- Adding every widget available. A board with 15 widgets is no easier to scan than the full Stats page — the point of Custom Board is curation, not completeness.
- Ignoring widths. Tables squeezed into half-width columns become hard to read; give Top Pages and Referrers full width if they're a priority.
- Forgetting it's per-site. Each site has its own board — a layout you build for one site doesn't automatically apply to another, which is useful if your sites serve very different purposes (a blog vs a checkout funnel, for example).
For background on choosing which numbers actually deserve a spot on any dashboard, see which analytics KPIs belong on your dashboard and dashboard design principles.
Build your own dashboard with statpx
Add, remove, and rearrange widgets in seconds — free forever plan included, no credit card required.
Start for free →The Bottom Line
Custom Board exists because "the dashboard" means something different to every site owner. Start from the default five-KPI layout, add the two or three widgets you actually check daily, and remove or resize the rest. A focused board with six widgets you glance at every morning beats a comprehensive one you stop opening after the first week. Once your board reflects your priorities, revisit the full Stats page whenever you need the complete picture behind any single number.