
How to Set Up Traffic Alerts in statpx: Email and Webhook Notifications
Most site owners check their analytics dashboard once a day — or less. That's fine for routine review. But it means you won't know about a sudden traffic spike until the next time you happen to log in. By then, the viral post has already gone cold, the press mention has passed, or worse, the server error that killed your traffic has been running for 12 hours.
Traffic alerts flip this around. Instead of you going to the data, the data comes to you. statpx lets you set threshold-based alerts that fire an email or webhook the moment traffic crosses a threshold you define — up or down.
Why Traffic Alerts Matter
There are two kinds of traffic events worth knowing about immediately:
Traffic spikes — a sudden surge above your normal baseline. This usually means something good happened: a journalist mentioned you, your post hit the front page of a community, a large account shared your link. When a spike happens, the window to act is short. Responding to social engagement, posting a follow-up, or temporarily upgrading your hosting to handle load — these actions are only possible if you know the spike is happening.
Traffic drops — a sudden fall below your normal baseline. This often signals a problem: your site went down, a critical page returned a 500 error, your top referrer removed your link, or a search ranking dropped overnight. A drop alert gives you a chance to investigate and fix the problem before it compounds over days.
Checking your dashboard daily catches neither of these reliably. Alerts do.
Creating Your First Alert
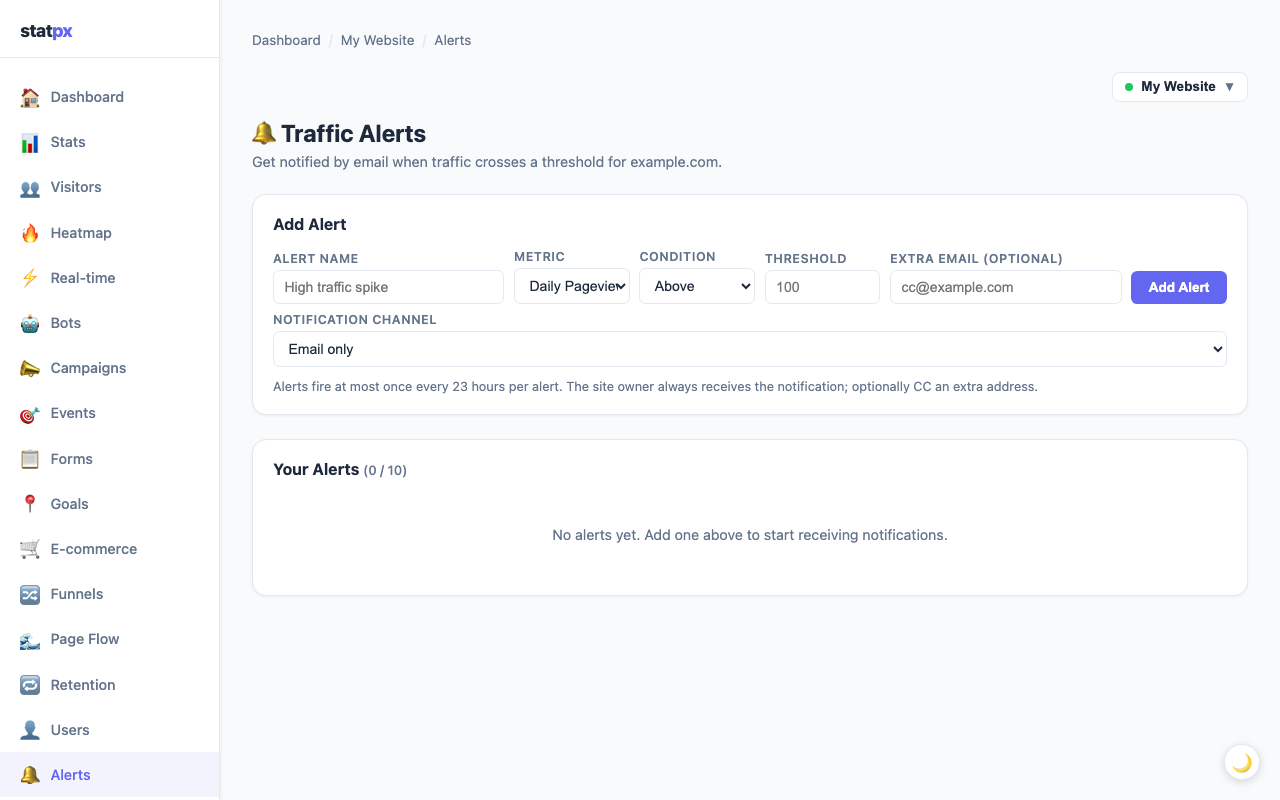
Navigate to the Alerts page for your site in statpx — you'll find it in the site navigation. Click New Alert to open the alert creation form. You'll configure four things:
- Alert Name — a descriptive label like "Daily spike alert" or "Morning traffic drop"
- Metric — what to measure (pageviews or sessions, daily or hourly — details below)
- Condition — Above for spike alerts, Below for drop alerts
- Threshold — the number that triggers the alert
For example: a spike alert for a site that normally gets 80 pageviews per day might be configured as Pageviews Daily → Above → 200. That fires the moment a single day accumulates more than 200 pageviews — a clear signal that something unusual is driving traffic.
Understanding Alert Metrics
statpx offers three metric types for alerts, each suited to a different kind of monitoring:
- Pageviews Daily — total pageviews accumulated in the past 24 hours. This is the right metric for detecting sustained surges or sustained drops. Checked periodically throughout the day.
- Pageviews Hourly — total pageviews in the past 60 minutes. Use this to catch sudden spikes that appear and disappear quickly, like a viral social post or a brief mention in a live stream. Hourly metrics fire faster but are more sensitive to normal fluctuations.
- Sessions Daily — unique visits in the past 24 hours. Sessions are a better measure of actual audience size than pageviews, since a single visitor browsing many pages counts as one session but many pageviews. Use this metric when you care more about reach than page consumption.
For most sites, start with Pageviews Daily for both a spike and a drop alert. Add an Hourly alert only if you're running a time-sensitive campaign and need near-real-time notification.
Setting the Threshold
Choosing the right threshold is the step most people get wrong. Set it too low and you'll get false alarms for normal day-to-day variation. Set it too high and you'll miss the events that actually matter.
A practical approach:
- For a spike alert: look at your last 30 days of daily pageviews and find the highest normal day (not a fluke). Set your spike threshold at 2x that number. This way the alert only fires on genuinely unusual traffic, not on a good-but-normal day.
- For a drop alert: find your average daily pageviews over the last 30 days. Set the drop threshold at 40-50% of that average. If you normally get 100 pageviews per day, a drop below 40-50 is worth investigating.
- For a new site: if you don't have 30 days of data yet, start with a round number slightly above your current best day and adjust after a few weeks of data accumulation.
You can have up to 10 alerts per site. Use that capacity to cover multiple scenarios: a spike alert, a drop alert, an hourly spike during a specific campaign period. Each alert fires independently.
Email vs Webhook Notifications
When an alert fires, statpx can notify you in three ways:
Alert sent to your account email address. You can add a secondary email (e.g. a team inbox) in the alert form. Simple and reliable — no external setup needed.
Webhook
Posts a JSON payload to any URL you specify. Works with Slack, Discord, Make.com, Zapier, n8n, or any custom endpoint. Full control over where the notification lands.
Selecting Both sends an email and a webhook simultaneously — useful if you want a personal email notification plus a channel message for your team.
Setting Up a Slack Webhook
Slack is the most common webhook destination. Here's how to connect it in three steps:
- In Slack, go to Apps → search for Incoming WebHooks → click Add to Slack. Choose the channel where you want alert messages to appear and click Add Incoming WebHooks Integration.
- Slack generates a webhook URL that looks like
https://hooks.slack.com/services/T.../B.../.... Copy that URL. - Back in statpx, paste the webhook URL into the Webhook URL field on the alert form. Save the alert.
When the alert fires, Slack will receive a message with the alert name, the metric value that triggered it, and a link directly to your statpx dashboard. To test it immediately, temporarily set the threshold to 1 (any traffic will trigger it), wait a few minutes, then set the real threshold once you've confirmed the message arrives in Slack.
Discord users: Discord supports incoming webhooks natively. Go to your server settings → Integrations → Webhooks → create a new webhook for your chosen channel. The URL format works directly in statpx without any modification.
Managing Your Alerts
All your configured alerts appear in a table on the Alerts page. From there you can:
- Toggle enable/disable — pause an alert temporarily without deleting it. Useful during planned maintenance windows when you expect traffic to drop below your threshold.
- View last triggered time — each alert shows when it last fired, so you can quickly see whether a recent event generated a notification and when.
- Edit or delete — update the threshold as your site's baseline traffic changes over time, or remove alerts you no longer need.
A good habit is to review your alert thresholds every quarter. As your site grows, your "normal" traffic level rises — thresholds that were meaningful at 50 pageviews per day become irrelevant once you're at 500. Adjust accordingly so your alerts stay signal rather than noise.
For more context on what constitutes a meaningful traffic spike and how to respond when one occurs, see the traffic spike alerts guide. If you're new to statpx and haven't set up tracking yet, start with the getting started guide first.
Start tracking your website for free
statpx gives you privacy-friendly analytics with no cookie banners, no data limits, and no credit card required. Set up takes under 5 minutes.
Get started free →The Bottom Line
Traffic alerts are one of the highest-leverage things you can set up in statpx. Five minutes of configuration pays off every time something unusual happens to your traffic — which, if you're actively promoting your site, will happen more often than you expect. Set a spike alert and a drop alert for your site today. You'll know about the good moments while they're still happening, and you'll catch problems before they become expensive.