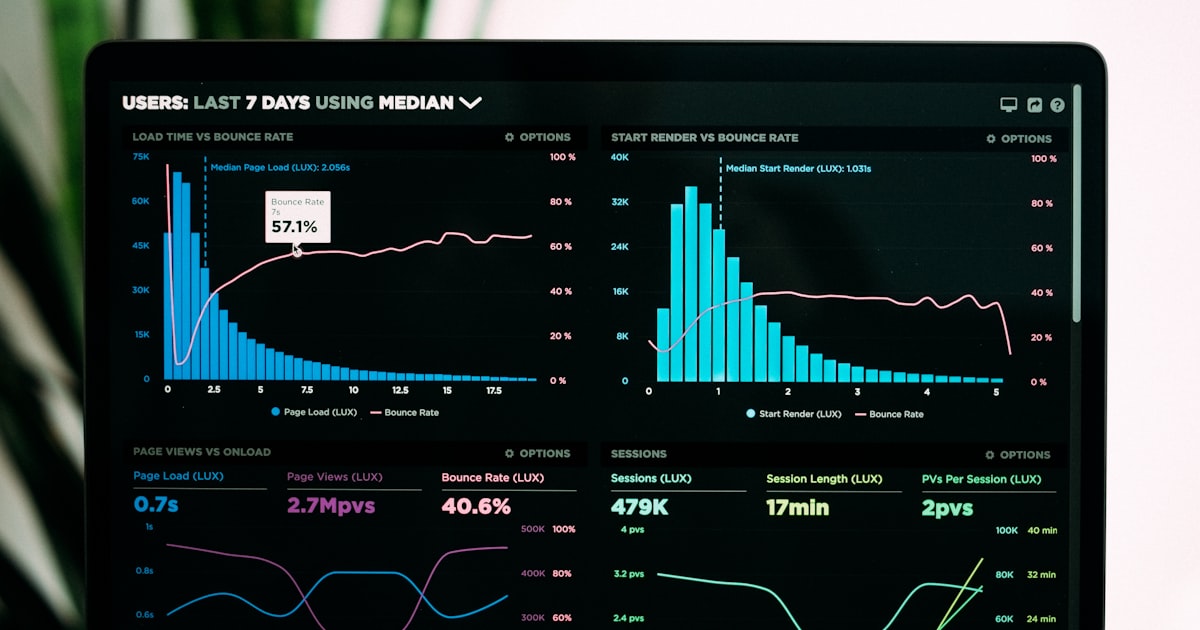
How to Read the statpx Click Heatmap: A Practical Guide
A standard traffic report tells you a page got 4,000 visits and a 45-second average time on page. It never tells you what happened during those 45 seconds. Did visitors scroll to the second section, or bounce off the hero? Did they try to click your logo expecting it to be a link? The statpx Heatmap answers exactly that by plotting every real click on a page as a point on a canvas overlay, colored from cool blue (low click density) to hot red (high click density). This guide covers how to turn it on, how to read the intensity map, and how to use it to find where visitors actually click.
What the Heatmap Page Shows
Open heatmap.php from the sidebar of any site in your statpx dashboard and you'll see a path selector at the top listing your most-visited pages. Pick a path — say /pricing or /blog/guide-heatmap.php — and statpx renders a canvas overlay built from the real click coordinates recorded on that exact page path, aggregated across every session that visited it in your selected date range. Unlike synthetic mouse-tracking estimates, every dot on the canvas corresponds to an actual click a real visitor made, normalized against the page's layout so it lines up correctly regardless of viewport size.
Because the heatmap is scoped to a single page path, you get a separate map per URL — your homepage heatmap looks nothing like your checkout page heatmap, which is exactly what you want when the two pages have completely different layouts and goals.
Enabling Click Tracking with One Line of Code
Heatmap capture is opt-in per page. Add this before your statpx tracking snippet loads:
Once window._stHeatmap is set to true, every click on that page is captured automatically — coordinates, the element clicked, and the current page path — with no extra markup or manual event wiring required. You can enable it site-wide by adding the flag to every template, or selectively on just the pages you want to analyze, such as a landing page you're actively optimizing.
Reading the Blue-to-Red Intensity Map
The color scale is intentionally simple: blue areas received few clicks relative to the rest of the page, and red areas received the most. Everything in between fades through the spectrum proportionally. A few patterns to look for once you have enough data loaded:
- A cold primary CTA. If your main call-to-action button stays pale blue while a nearby element glows red, visitors are engaging with something other than the action you want them to take.
- Warm zones on non-clickable elements. If a heading, image, or plain text block shows unexpected red, visitors are trying to click something that isn't interactive — a strong signal to turn it into a real link.
- A dead zone below the fold. If everything red sits in the first screen and the rest of the page is uniformly blue, most visitors never scroll far enough to reach content lower down.
Picking a Page Path and Finding Patterns
Start with your highest-traffic pages — usually the homepage, a top landing page, and your pricing or signup page — since they have the most click volume to build a meaningful map. After a layout change, switch to the Today or 7d range on that specific path to see quickly whether the new version is getting engagement in the areas you intended. Compare the heatmap of a converting page against one that underperforms with the same layout family; the difference in where clicks concentrate often explains the conversion gap better than any single metric can. Pair heatmap findings with user journey data to see not just where visitors click, but where that click takes them next.
See your own click heatmaps in minutes
statpx captures click coordinates automatically once you add one line of code. Privacy-friendly, no cookies required, free to start.
Start for free →The Bottom Line
A heatmap turns abstract click counts into a picture you can read in seconds. Instead of guessing why a page underperforms, you can look directly at where attention and interaction actually land, then move the elements that matter into the zones visitors are already engaging with. Enable window._stHeatmap on the pages you care about most, give it enough traffic to build a clean map, and revisit it every time you change a layout — it's the fastest way to confirm a redesign actually worked instead of just assuming it did. For a full picture of how visitors move through your site, read our guide on reading the statpx dashboard.